HardwareMonOpen source
Built in the open. Made for real desktops.Windows · Linux

Ever wonder what your
computer is doing?

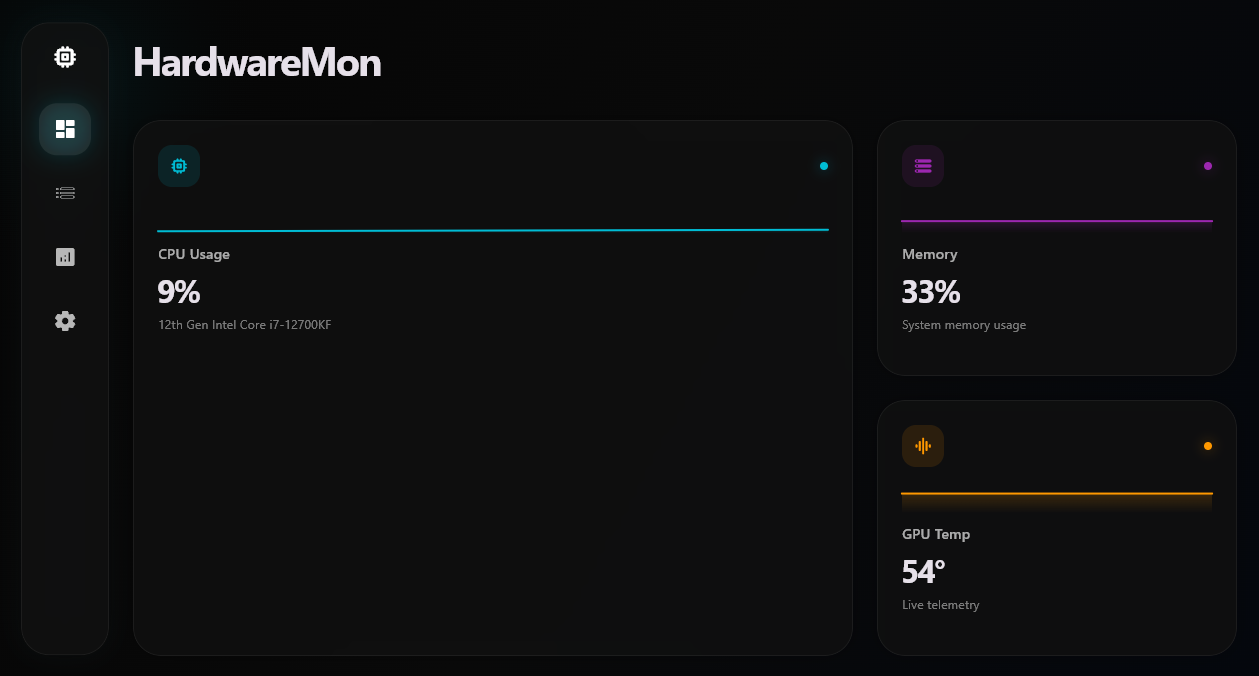
HardwareMon puts the useful answers in one place: what is busy, what is hot, what is slowing down, and what happened while you were not looking.

Free foreverWindows + LinuxNo account
HHardwareMonCOMMAND CENTRE
LOCAL--:--:--
PRIMARY WORKSTATION

System overview

Live
CPU28%Nominal
GPU61°Nominal
RAM11.8 GBNominal
NET842 Mb/sNominal
Performance activityLast 60 seconds
CPU PACKAGE48°+2.4° / 1m
UPLINK8.2 msStable route
There is a lot more down here
01Start with the useful bit

Most system monitors hand you numbers. We help you make sense of them.

See what is busy, what is getting hot, what is using your memory, and what changed before something felt slow. It is all in one place, with enough detail to be useful and none of the usual utility-app clutter.

CPU telemetryGPU analyticsMemory pressureWhat is using your systemNetwork monitoringStorage healthHistorical analyticsWindows + Linux
02A quick introduction

Meet your machine

Want the short version?
Press scan.

This little browser demo uses example hardware, but the real app does the same kind of detective work on your desktop: it finds the useful signals, names them clearly, and gives you somewhere sensible to start.

No browser permissions. No data leaves this page. The scan is a visual demo.
HardwareMon discoveryWAITING
ProcessorWaiting to inspect…
GraphicsWaiting to inspect…
MemoryWaiting to inspect…
StorageWaiting to inspect…
NetworkWaiting to inspect…
03The part you can actually click

Go on—click around

This is not a screenshot.
It is a working little demo.

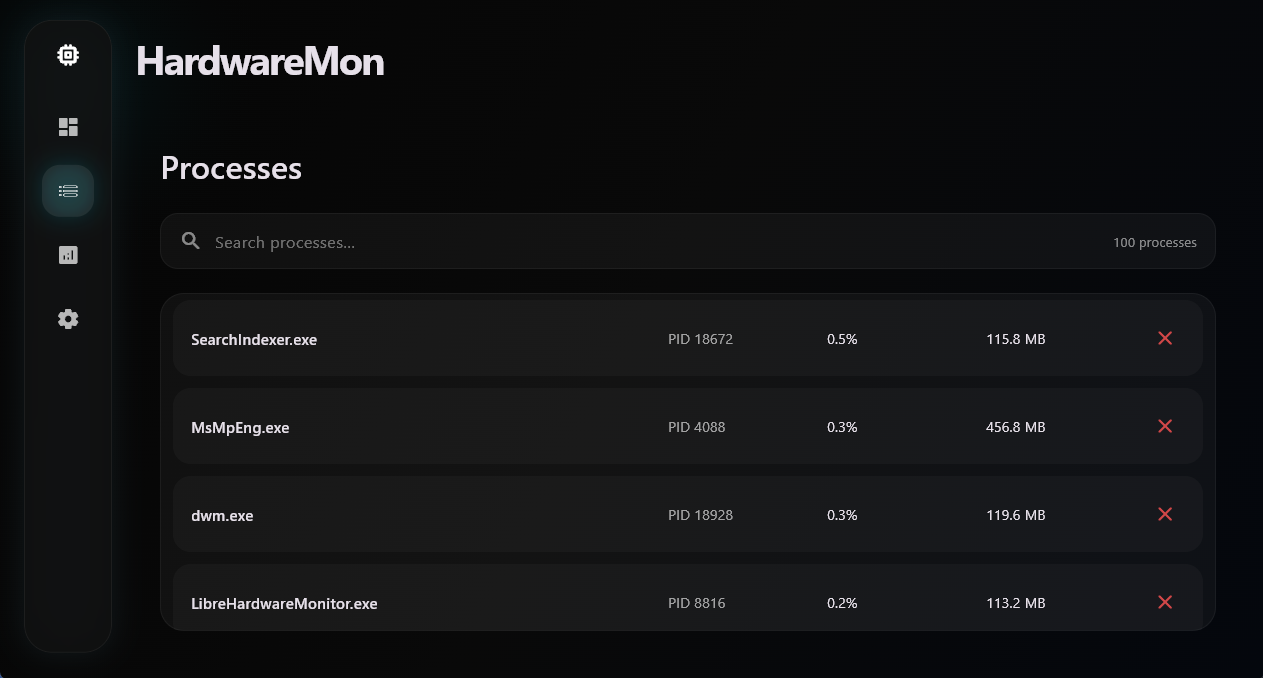
Open the process list. Change the layout. Inspect a drive. Switch to historical data. It is example telemetry, but the controls and the way the app thinks are real.

HHardwareMon
Good evening, Louis

Nothing needs your attention right now.

System healthy
CPU load
24%4.72 GHz
Memory
11.8GBof 32 GB
GPU
62°38% load
Combined activityLast 60 seconds
CPU Memory
SystemLive
Uptime
3d 08h
Processes
184
Network
842 Mb/s
Storage
62%

Live demo · Select a page from the dock

04Four questions people actually ask

High is not always bad

Why did the fans just spin up?

Start with CPU load, clocks, and temperature. If they rose together, you can see exactly when—and what else was happening.

CPU PERFORMANCE Live sample
4.72GHz12th Gen Intel Core i7
Average3.84 GHz
Peak4.91 GHz
StatusNominal
05Incident replay

Go back to the moment

“It stuttered.”
Okay. Let's see why.

Drag through this example session. HardwareMon keeps the signals together, so you can tell what happened first, what merely followed, and what had nothing to do with it.

Session replayExample gaming workload
21:14:19
CPU64%
GPU99%
Memory57%
Temperature69°C
What HardwareMon would show you

The GPU hit its limit.

GPU load reached 99%. CPU headroom remained, so the slowdown was not coming from the processor.

Thermal response trackedNetwork ruled outStorage ruled out
21:14:19
06History, with context

Something felt slow yesterday?

You do not have to wait
for it to happen again.

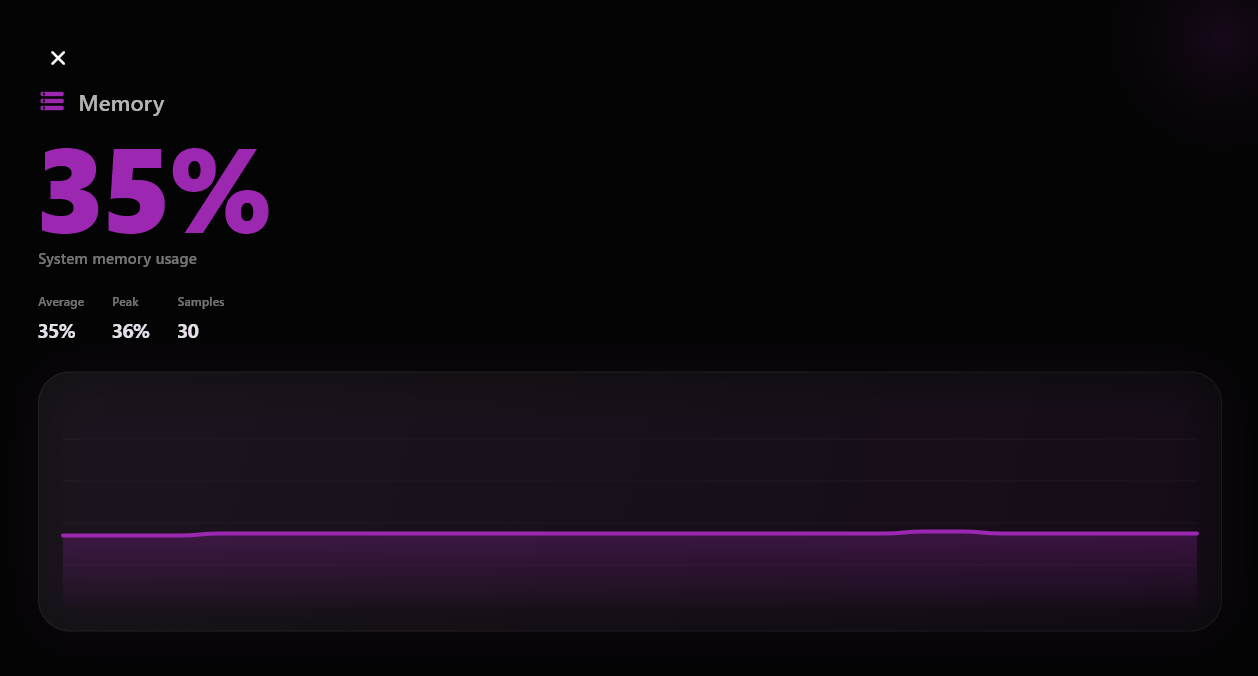
Go back an hour, a day, a week, or a month. Compare CPU, GPU, and memory, then move the cursor over the exact moment that looked wrong.

HTelemetry StudioHistorical session
100%
Today31.8%Average CPU load
Peak
81%
Samples
6480
Continuity
99.9%
Sample 3452.1% CPUMemory 31.9%
00:0006:0012:0018:00Now
07When the internet feels off

Stop guessing at the router

See where the connection goes
and where it slows down.

Which adapter is active? Is latency climbing? Is the machine downloading or uploading? The map makes those answers obvious before you start unplugging things.

Download842.6Mb/s
Upload94.2Mb/s
Latency8.2ms
Live topology Simulating traffic
Selected nodeThis workstation192.168.1.42
Healthy connection
08Workload lab

Try a few different days

Your computer looks different
depending on what you ask of it.

Pick a workload and watch the whole system fingerprint change. This is the useful bit: not simply seeing that a number is high, but understanding whether it makes sense.

System heatmap96 live regions
QuietBusy
System fingerprintGaming
CPUGPUMemoryNetworkTemp
What this tells you

Playing a game

The GPU is doing the heavy lifting. CPU load is healthy, so the graphics card is the current limit.

CPU
62%
GPU
97%
Memory
58%
Network
24%
Temperature
74°C
09Your drives, without the treasure hunt

Which drive is getting full?

Capacity is only half
the useful answer.

See space, speed, temperature, and health together. That way “62% used” does not hide a hot drive or a sudden drop in throughput.

62%USED
SYSTEM1 TB
42° Healthy
41%USED
PROJECTS2 TB
39° Healthy
78%USED
ARCHIVE2 TB
44° Healthy
10Put your priorities first

You know what you care about

Put the useful cards first.
Move the rest out of the way.

Drag the cards into your order, pick an accent, or tighten the layout when you want more information on screen. Try it here—the preview is live.

Accent environment
Edit dashboardDrag to reorder
  • 1CPU performancePrimary card · Full width
  • 2Memory pressureSecondary card
  • 3GPU thermalsSecondary card
  • 4Network activitySecondary card
Changes preview instantly and stay local to your dashboard.
11Whatever is on your desk

Windows? Linux? You are covered.

One project.
Two very different desktops.

HardwareMon respects the platform it is running on instead of pretending Windows and Linux are the same. The design stays familiar; the telemetry adapts underneath it.

Available

Windows

Download the installer, launch it like any other desktop app, and let HardwareMon handle the background details.

Explore installation
Available

Linux

Install it through familiar package tools and get telemetry that understands how Linux exposes hardware.

Explore installation
On the roadmap

Companion

A future way to glance at your main machine when you are away from the desk.

Follow the roadmap
Desktop-first Shared design languageLocal-first telemetryOpen-source foundation
12You can inspect the whole thing

No black box

Wondering how it works?
Go and have a look.

The code, releases, bugs, and roadmap are public. You can report something odd, suggest the next feature, or pull the project apart and build your own version.

louisboii747 / HardwareMonPublic · MIT License
MITOpen-source license
2Desktop platforms
Ways to contribute
H
Built in public, improved in the openReleases, issues, discussions, and source are visible to everyone.
Shipped

Desktop foundation

A focused monitor for live system telemetry.

Shipped

Analytics expansion

Processes, storage, networking, and richer performance views.

Growing

Platform maturity

Installers, repositories, update systems, and desktop integration.

Roadmap

The next horizon

Deeper customization, longer history, and companion apps.

Your idea could become part of HardwareMon.Fork it, shape it, test it, or simply tell us what your system needs.
13Ready when you are

Detecting platform…

Want to try it?
Pick your platform.

We have already picked the most likely option for this device. You can switch packages if we guessed wrong, then install the latest public release.

Windows

Install HardwareMon

Latest
1

Download installer

2

Run the guided setup

3

Launch HardwareMon

HHardwareMon SetupGetting HardwareMon ready
Installing system components…86%
View Windows release
Latest stableLatest release
Free and open source No account required Windows and Linux
14A few things you might be wondering

The practical stuff

Before you give it a go.

What is HardwareMon?

It is an open-source desktop app for seeing what your computer is doing. CPU, GPU, memory, network, storage, processes, and historical data all live in the same place.

Does HardwareMon work on Linux and Windows?

Yes. There is a Windows installer and Linux package support. The interface stays familiar, while the telemetry underneath adapts to each operating system.

Is HardwareMon free and open source?

Yes. It is free, released under the MIT License, and developed in public. You can read the code, follow releases, report bugs, or contribute on GitHub.

What hardware can HardwareMon monitor?

It covers CPU, GPU, memory, network, storage, and running processes. The exact sensors depend on your operating system and hardware, so unavailable readings are shown honestly rather than replaced with made-up values.

Your computer already has the answers

You should not have to guess
what it is doing.